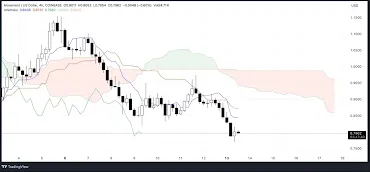
Technical indicators such as the RSI and Ichimoku Cloud are signaling a pronounced bearish trend for MOVE, which is trading near oversold levels and significantly below the Ichimoku Cloud.
The emergence of a "death cross" pattern has further confirmed the bearish outlook, indicating intensified selling pressure. For MOVE to recover, it must break through key resistance levels. If the current support fails, MOVE may continue to decline.
MOVE's RSI Nears Oversold Territory
MOVE's RSI is currently at 33.3, showing a slight recovery from 29.7 a few hours ago. This represents a notable decrease from an RSI of 53 just two days prior, indicating a rapid shift from neutral to oversold territory.
The Relative Strength Index (RSI) is a momentum indicator ranging from 0 to 100, used to assess whether an asset is overbought or oversold. Typically, an RSI below 30 suggests oversold conditions and potential undervaluation, while an RSI above 70 indicates overbought conditions and a potential price correction.
With the RSI at 33.3, MOVE remains near oversold territory, which may attract investors seeking to capitalize on low prices. This level implies that recent selling pressure might be easing, offering potential for price stabilization or recovery.
However, if the RSI fails to move back to neutral territory, it could signal persistent bearish momentum, continuing to exert downward pressure on MOVE's price in the short term, despite Movement Labs, the company behind MOVE, raising $100 million in funding.
Bearish Configuration in MOVE's Ichimoku Cloud Chart
MOVE's Ichimoku Cloud chart shows a clear bearish configuration, with the price significantly below the cloud (Kumo). The red, expanding cloud indicates increasing bearish momentum and sustained selling pressure, suggesting that the current trend remains strongly bearish with no signs of short-term weakening. The recent correction has caused MOVE to drop out of the top 50 altcoins, currently ranking 59th.
The conversion line (blue) is below the baseline (red), confirming short-term bearish momentum. Additionally, the lag line (green) is below both the price and the cloud, reinforcing the negative outlook.
All indicators within the Ichimoku system point to the continuation of the downtrend, with no clear reversal signals. The overall structure of the cloud and lines reflects a market environment dominated by selling pressure.


Post a Comment